

Summary Cards
Four summary cards give you an overview of your brand’s factual accuracy across AI-generated answers:- Accuracy: The percentage of checked claims that match your facts. Calculated as accurate claims divided by total claims checked.
- Total claims: The number of unique claims checked against your facts. Each distinct claim is counted once, even if it appears in multiple answers.
- Inaccuracies: The number of unique claims that contradict your facts.
- Pages driving inaccuracies: The number of cited pages associated with inaccurate claims, including pages you own and external pages that may require outreach.

Tip: Each card shows the change from the previous period, so you can see whether your fixes are working. Click on metrics in blue to dig deeper into the data.
Accuracy Trend
The Accuracy Trend chart shows how your brand’s factual accuracy changes over time. Use the dropdown above the chart to switch views, or enable Previous period to compare performance against the preceding period.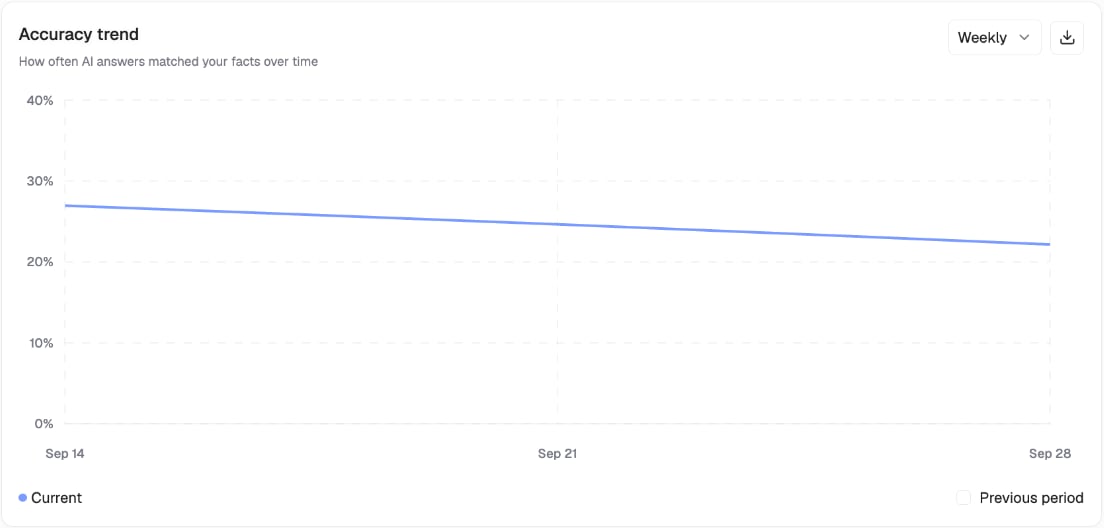
Inaccurate Sources Breakdown
This chart shows the types of sources associated with inaccurate claims:- Your brand
- Competitor
- Third party websites
- Social & Forums

How to interpret this breakdown
- Your brand: If a large share of inaccuracies comes from your own pages, review them for outdated, incorrect, or unclear information.
- Competitor: Check whether competitor-owned pages contain incorrect claims about your brand.
- Third party websites: Identify external pages that may need corrections or updates.
- Social & Forums: Review discussions where inaccurate information about your brand appears.
Claims by Topic
See how accurately AI platforms represent your brand across different topics. For each topic, you’ll see its Accuracy and number of Inaccuracies. Accuracy is calculated independently for each topic. Click an inaccuracy count to investigate the claims associated with that topic.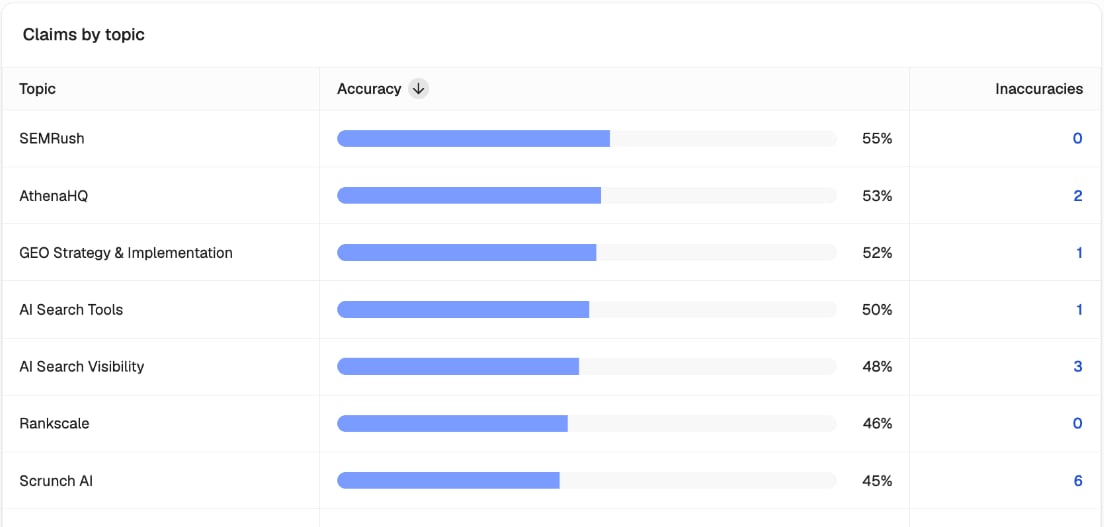
Top Inaccuracies Mentioned Across AI Answers
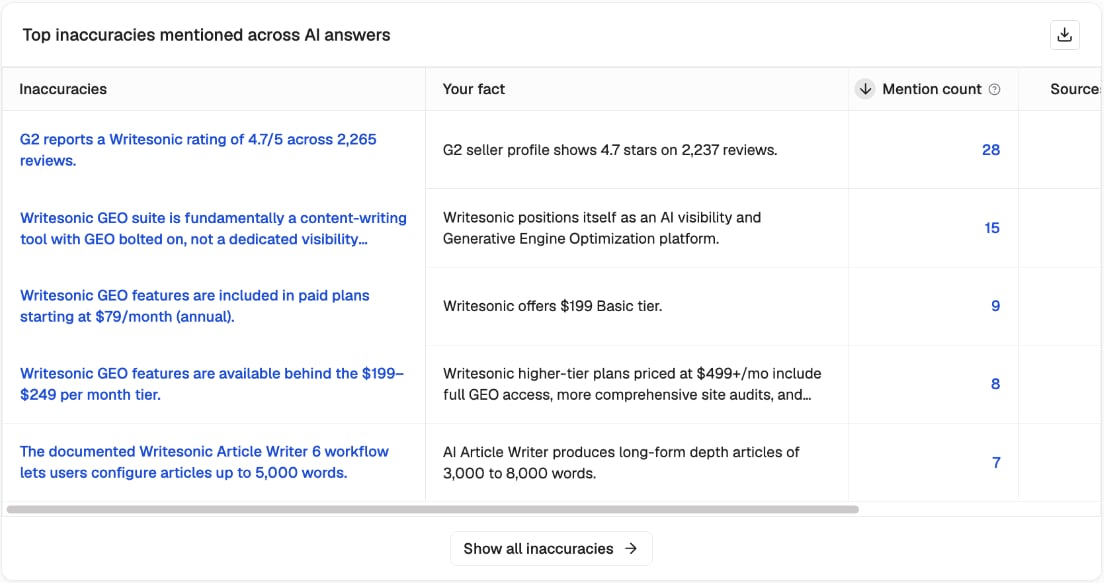
The inaccurate claims that come up most often. For each claim, you’ll see:- Your fact: the fact the claim contradicts.
- Mention count: how many times the claim came up across AI answers. Every repeat counts, including more than once in the same answer.
- Sources of inaccuracy: how many pages contain the claim.
Top Citations With Inaccuracies
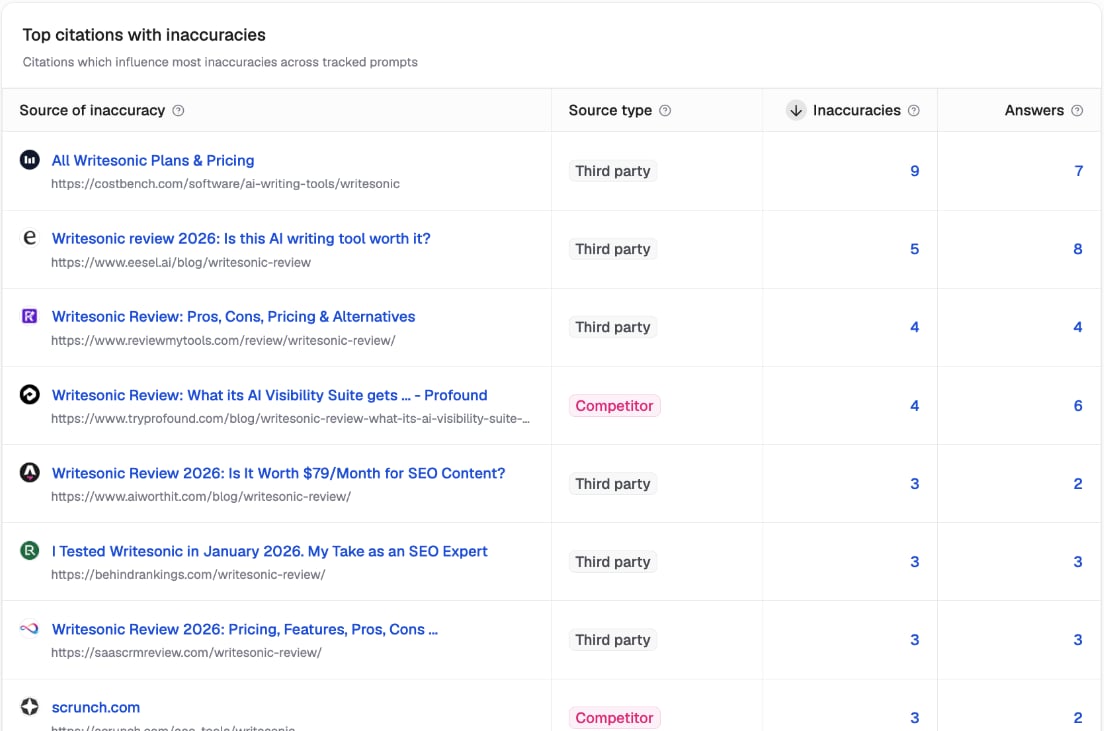
The pages that drive the most inaccurate claims about your brand. For each page, you’ll see:- Source type: whether the page is yours, a competitor’s, or a third party’s.
- Inaccuracies: claims on this page that contradict your facts.
- Answers: how many tracked AI answers cited this page.
Most Misrepresented Facts
See which of your facts are contradicted most frequently in AI-generated answers. Use this section to identify recurring misconceptions about your brand and prioritize which ones to investigate.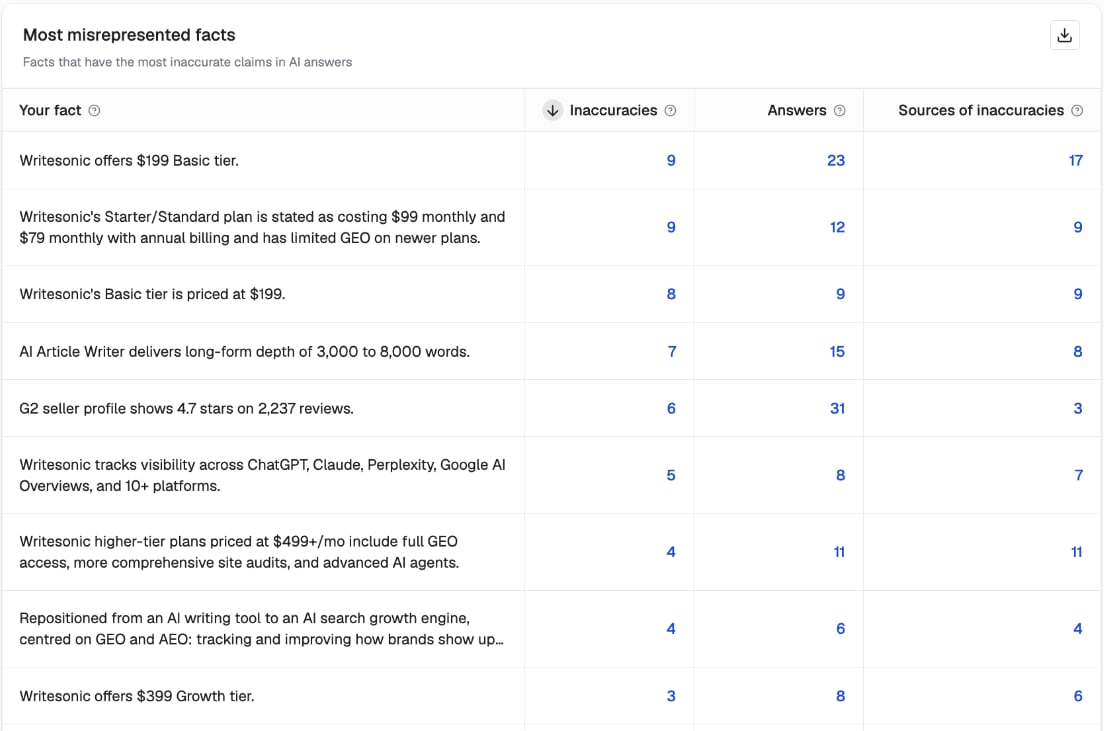
Accuracy Breakdown
Breaks accuracy down by Prompt or by Platform. Switch between the tabs to see which prompts, or which AI platforms, are least accurate about your brand.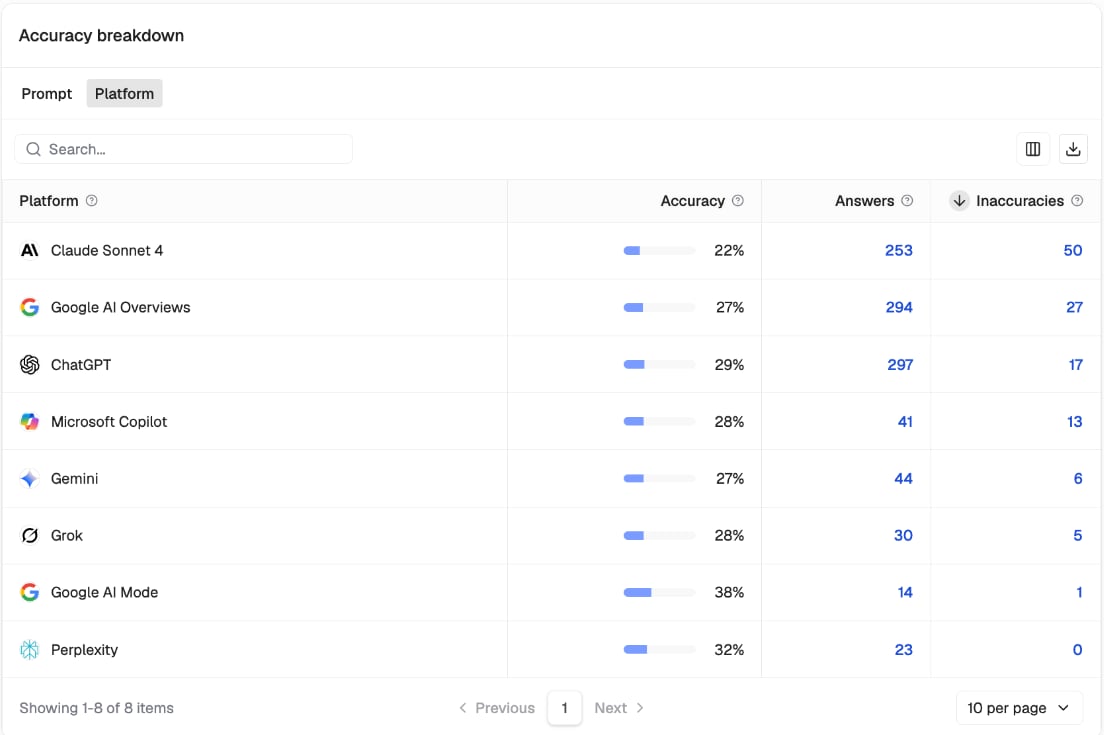
Action Tip: Prompts and platforms with low accuracy and high answer counts are your biggest risk. Prioritize the sources behind them first.