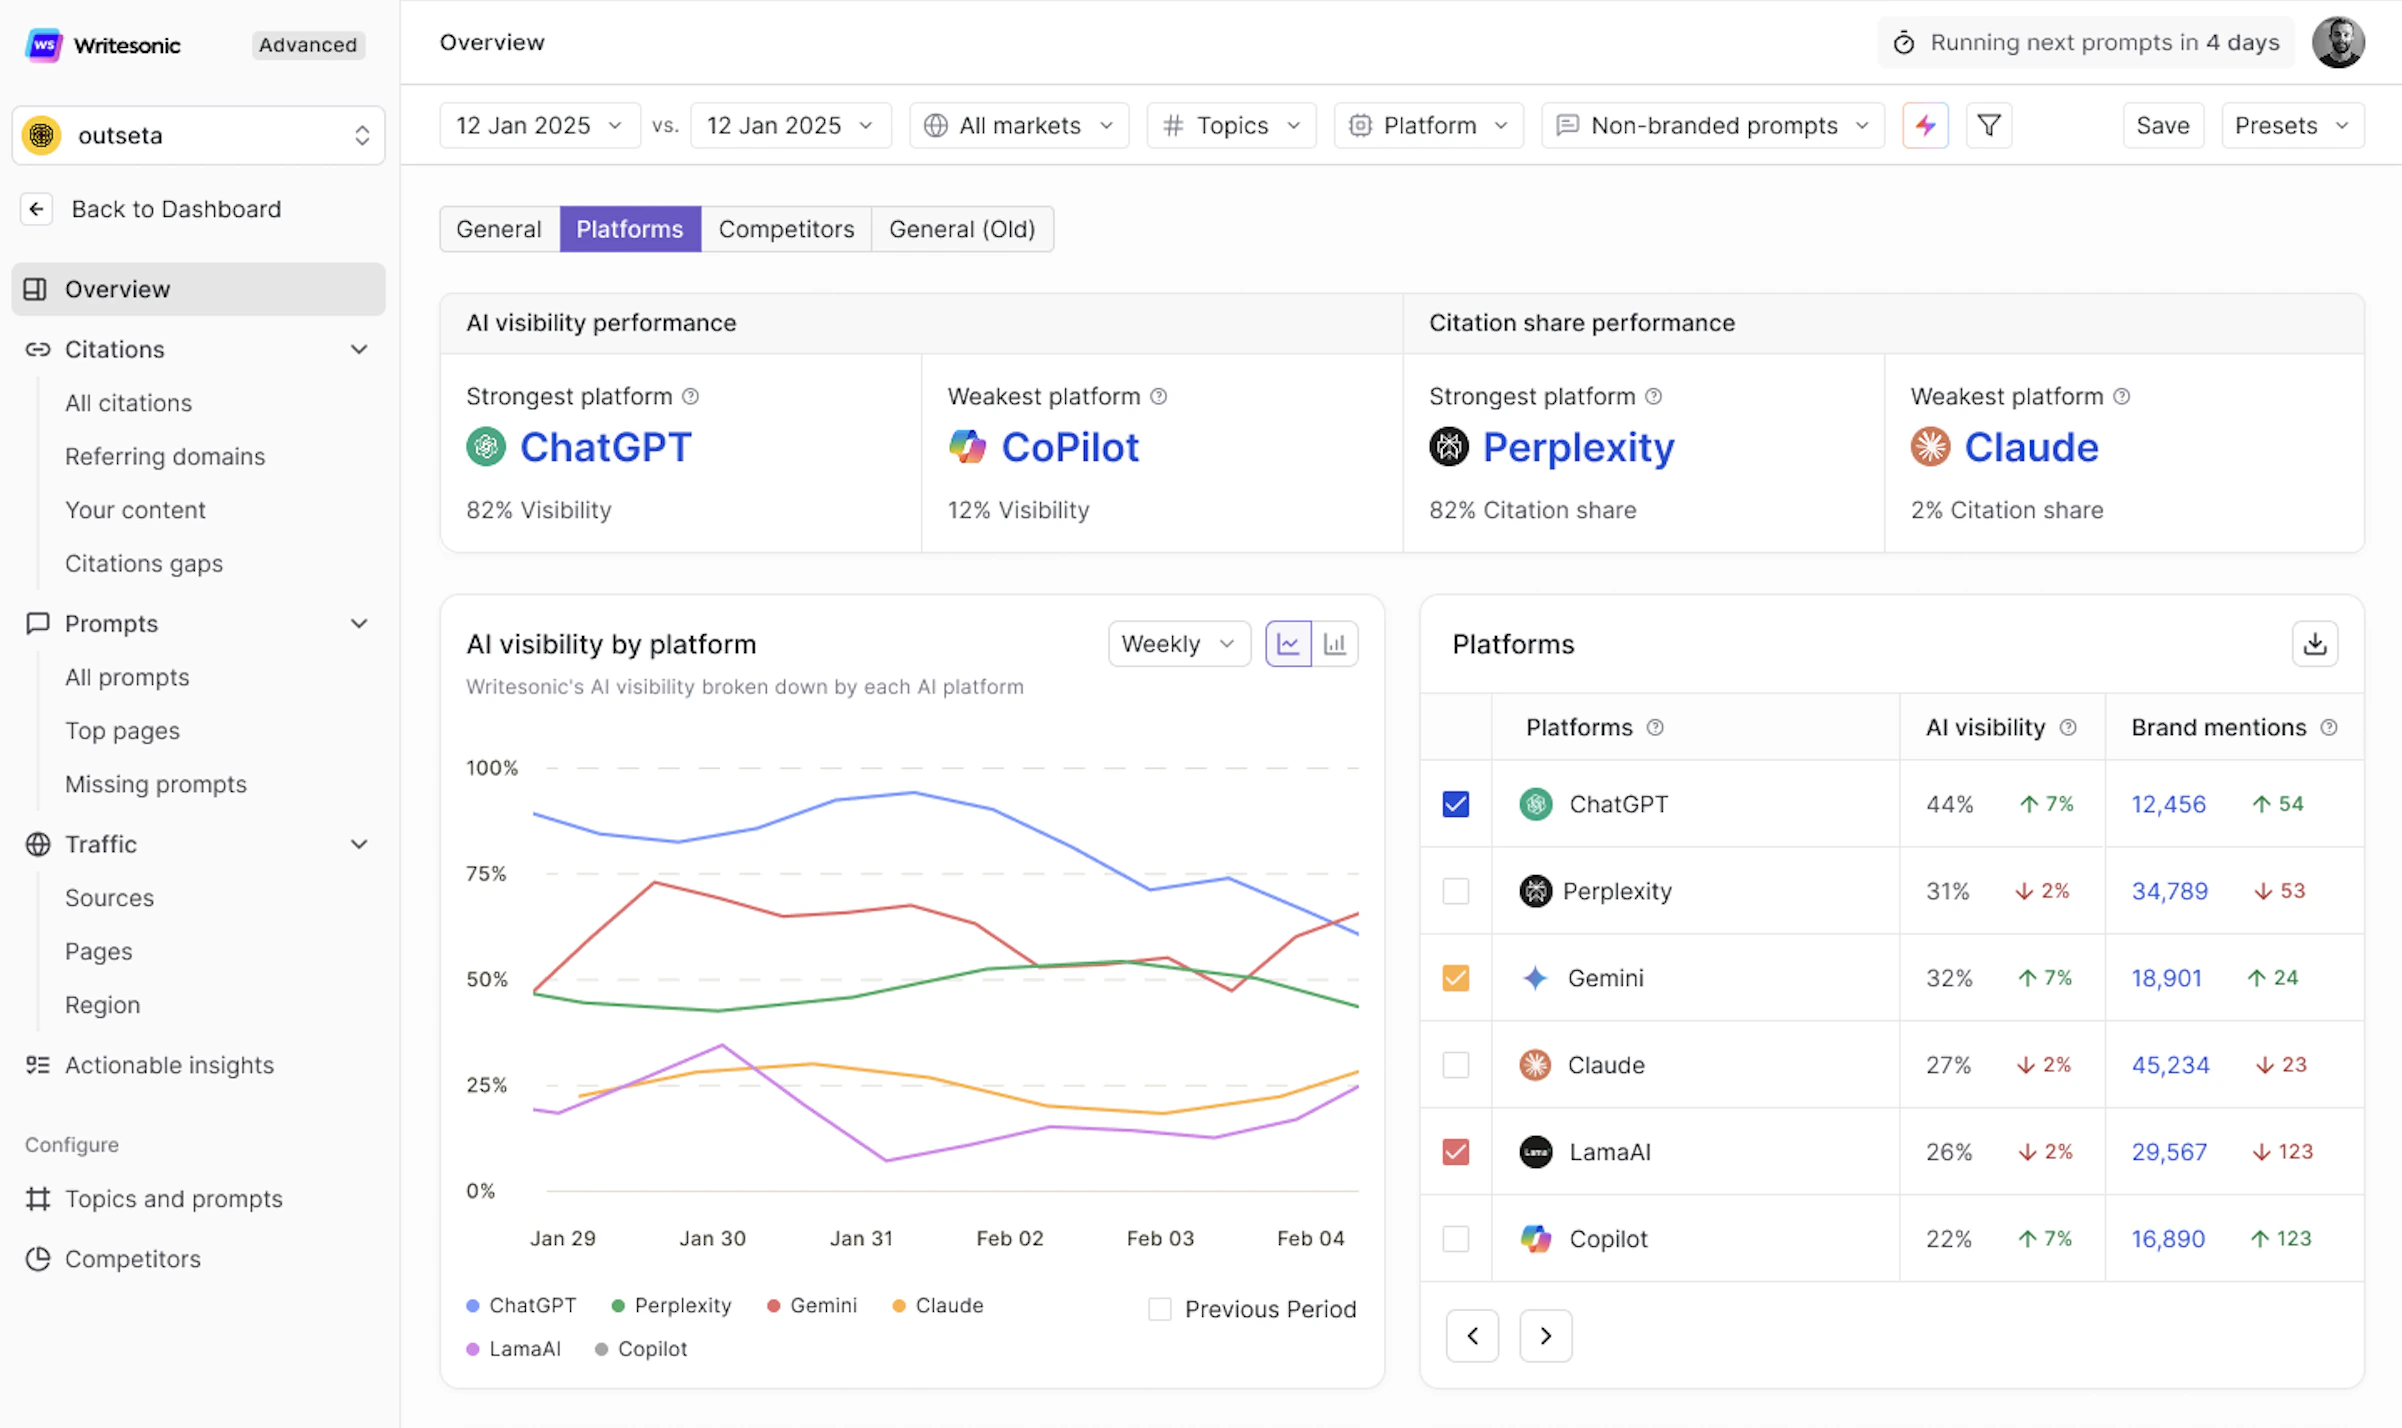
How to access: Navigate to Overview from the left sidebar, then click the Platforms tab at the top of the page.
AI Visibility Performance
This section gives you an instant snapshot of your best and worst-performing AI platforms based on visibility.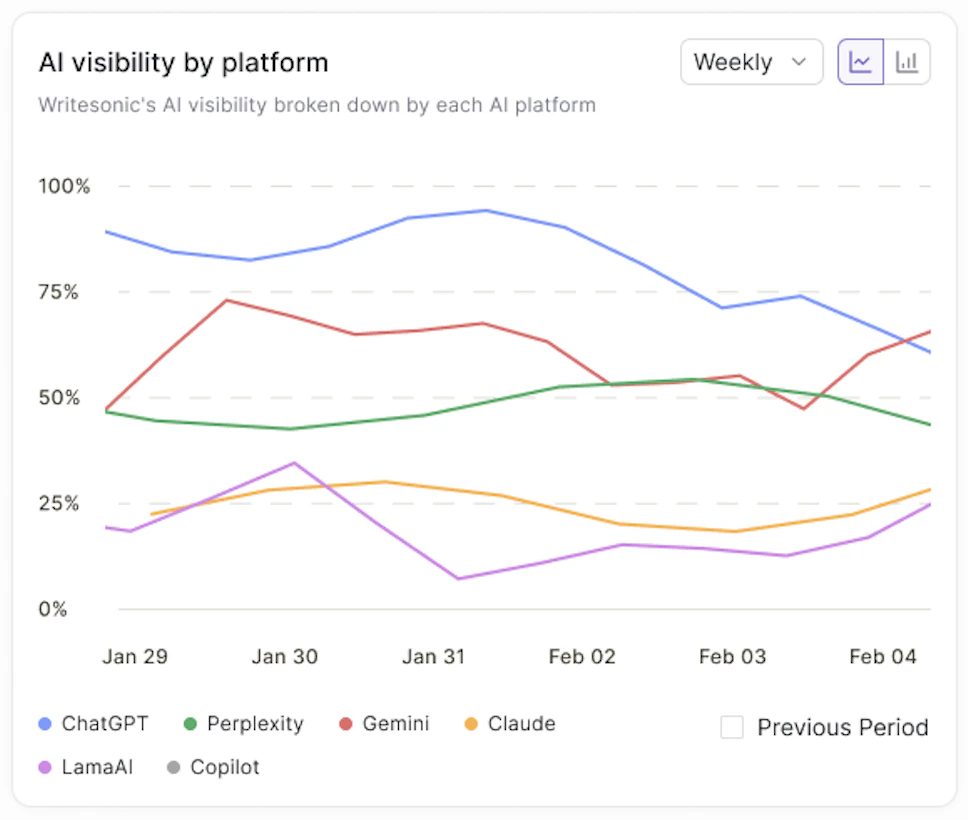
- Strongest Platform: The AI engine where your brand achieves the highest AI visibility percentage. This is where your content is most frequently referenced in AI-generated answers.
- Weakest Platform: The AI engine where your brand has the lowest AI visibility percentage. This represents your biggest untapped opportunity.
Citation Share Performance
Sitting alongside AI visibility, this section focuses specifically on citation share — how often AI platforms cite your website as a source in their responses.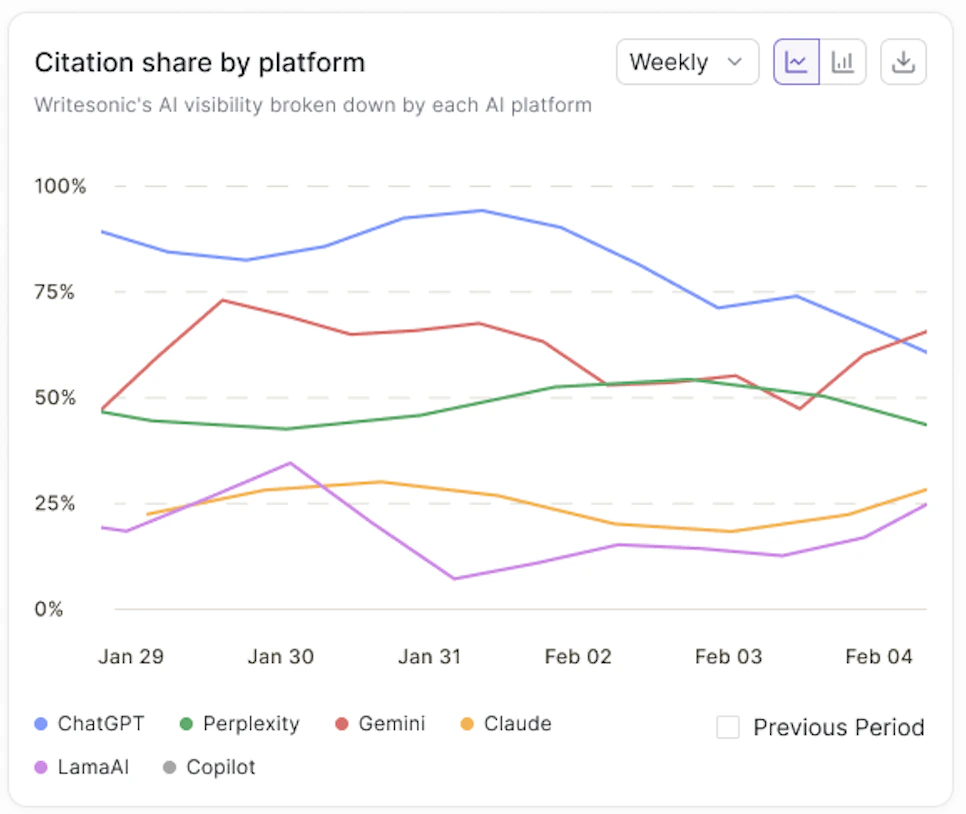
- Strongest Platform (Citation Share): The AI engine that cites your content most frequently as a source.
- Weakest Platform (Citation Share): The AI engine that cites your content least frequently.
AI Visibility by Platform (Trend Chart)
This chart tracks your brand’s AI visibility percentage across each platform over time. Each AI platform is represented by a distinct colored line, giving you a multi-dimensional view of your performance trajectory. What you can do with this chart:- Spot platform-specific trends: See if your visibility is rising on one platform while declining on another.
- Correlate changes with actions: Did a content update or optimization effort coincide with a visibility spike on a specific platform?
- Identify algorithm or behavior shifts: A sudden drop on a single platform may signal a platform-level change rather than a content issue.
- Toggle platforms on/off to focus on specific comparisons.
- Switch between Weekly views and adjust date ranges as needed.
- Enable “Previous Period” comparison to see how current performance stacks up against the prior period.
Platforms Table (AI Visibility)
Next to the trend chart, the Platforms table provides a detailed, sortable breakdown of each AI platform’s performance metrics. Columns include:- Platform name and icon for quick identification.
- AI Visibility (%): The percentage of tracked prompts where your brand appears in that platform’s AI-generated responses.
- Change indicator: Shows whether visibility has increased (↑) or decreased (↓) compared to the previous period, along with the percentage change.
- Brand Mentions: The total number of times your brand was mentioned across all tracked prompts on that platform.
- Mentions change indicator: Shows the increase or decrease in brand mentions compared to the prior period.
Citation Share by Platform (Trend Chart)
Similar to the AI visibility trend chart, this visualization tracks citation share — the percentage of AI responses that cite your website as a source — broken down by platform over time. What you can do with this chart:- Compare citation trends across platforms to see where your content is gaining or losing trust.
- Identify citation-visibility gaps: A platform where you have high visibility but low citation share may be mentioning your brand without linking to your content — a signal to optimize for citations specifically.
- Toggle platforms and adjust date ranges for focused analysis.
Platforms Table (Citation Share)
Alongside the citation trend chart, this table mirrors the AI visibility table but focuses on citation-specific metrics. Columns include:- Platform name and icon.
- Citation Share (%): The percentage of AI responses on that platform that cite your website.
- Change indicator: Increase or decrease vs. the previous period.
- Citing Answers: The total number of AI-generated answers that include a citation to your content on that platform.
- Citing answers change indicator: Shows the trend in citing answers.
Topic-Wise Visibility by Platform
This section provides a cross-platform, topic-level heatmap of your brand’s AI visibility. It maps each of your tracked topics against each AI platform, showing the visibility percentage in a color-coded grid.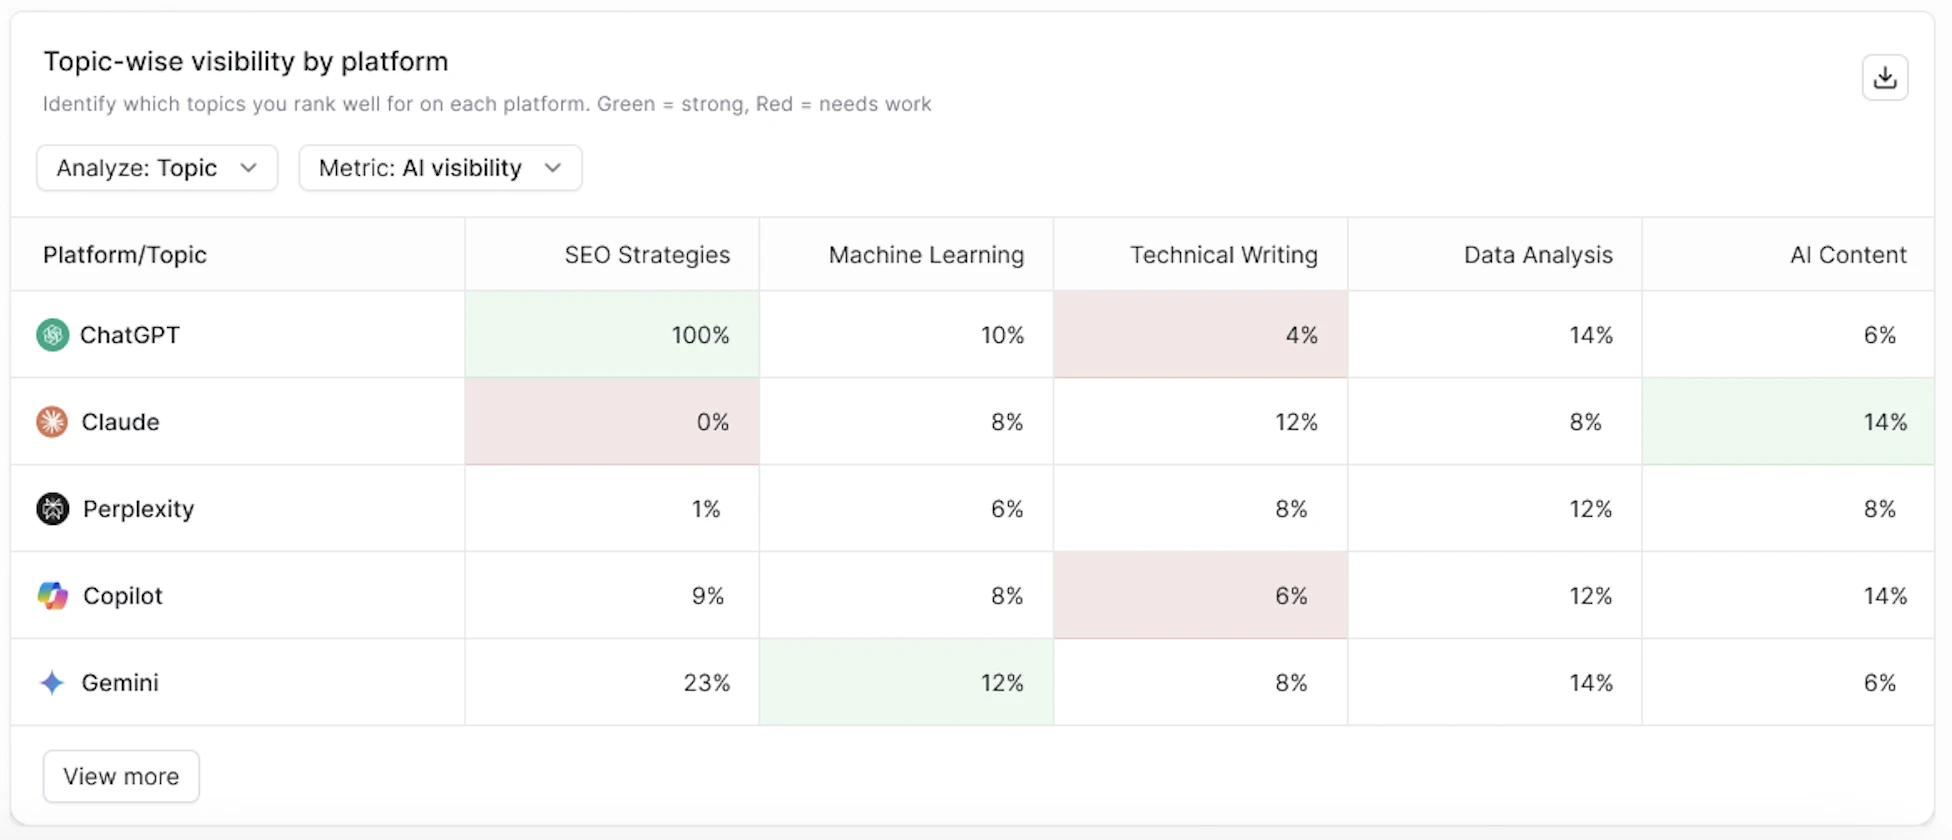
- Green cells indicate strong visibility for that topic on that platform.
- Red cells indicate low visibility — areas that need attention.
- Analyze by: Switch between Topic and Prompt level views for granularity.
- Metric: Toggle between AI Visibility and Citation Share to see both dimensions.
- “Which topics am I strong on across all platforms, and which are platform-specific gaps?”
- “Is there a topic where I have zero visibility on every platform — signaling a major content gap?”
- “Which platform-topic combinations should I prioritize for optimization?”
Best Practices for Using Platform Insights
- Compare visibility and citation share together. A platform where you’re mentioned often but rarely cited may need content improvements that make you more “citable” — structured data, authoritative sources, clear formatting.
- Use trend charts to validate your efforts. After publishing optimized content or running an outreach campaign, check the trend charts to see if specific platforms responded.
- Prioritize platforms your audience uses. Not all AI platforms carry equal weight for your business. Focus optimization efforts on the platforms your target customers are most likely to use.
- Investigate sudden changes. A sharp drop or spike on a single platform usually points to a platform-specific cause — algorithm update, competitor activity, or content indexing changes. Use the date range filters to narrow down when it happened.
- Leverage the topic-platform heatmap for content planning. Red cells in the heatmap are your roadmap. Build or optimize content specifically for those topic-platform gaps.
Overview: Competitors Sentiment